
Amazon Ads Live? Track, Analyze, Optimize: A Performance Guide
Ad campaign strategies are numerous, and many sellers encounter this challenge after running ads: tracking ad performance is difficult!
- Sometimes, records are not timely, leading to ineffective ad performance tracking.
- Too many ads make recording a huge undertaking!
- Want third-party monitoring software, but it's too expensive!
- ......
Actually, tracking ad campaign performance isn't difficult, you just haven't found the right method and tool. Xiao You (I) have a very useful and free tool for tracking ad performance: the Ad Hourly Trends chart!
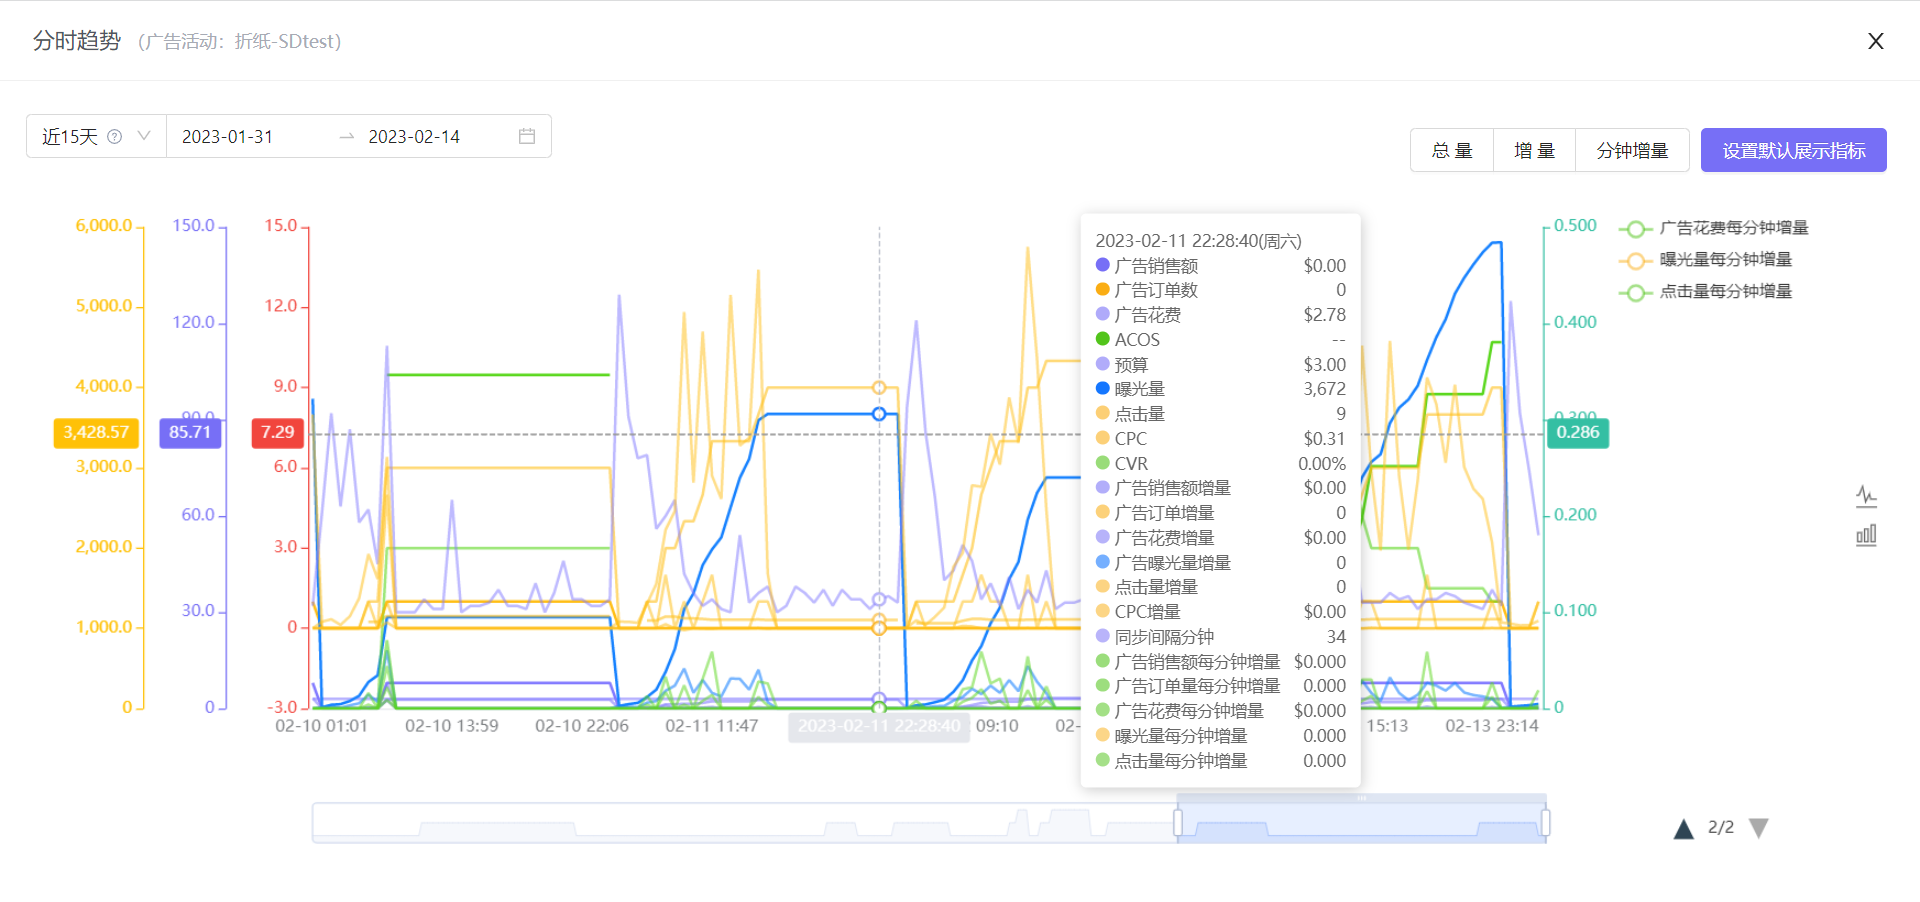
SellerSpace - Ad Hourly Trends Chart
Time Range: Hourly trends for the last 15 days
Tracking Objects: Campaigns, Placements, Ad Groups, Promoted Products, Keywords, Product Targeting. Needs to be viewed within the corresponding feature modules.
Key Metrics: Ad Sales, Ad Orders, Ad Spend, Budget, Impressions, Clicks, Bids, CPC, CPC to Bid Ratio.
Three Dimensions: Total Trends, Incremental Trends, Minute Incremental Trends
Chart Modes: Table, Line Trend, Bar Chart Trend
Export Format: PNG image
 +
+
How to Track and Analyze Ad Performance Using the Hourly Trends Chart?
Once you've launched ads, you can directly use the Ad Hourly Trends chart to track adjusted campaign data, without having to constantly monitor ads, or manually record and analyze data.
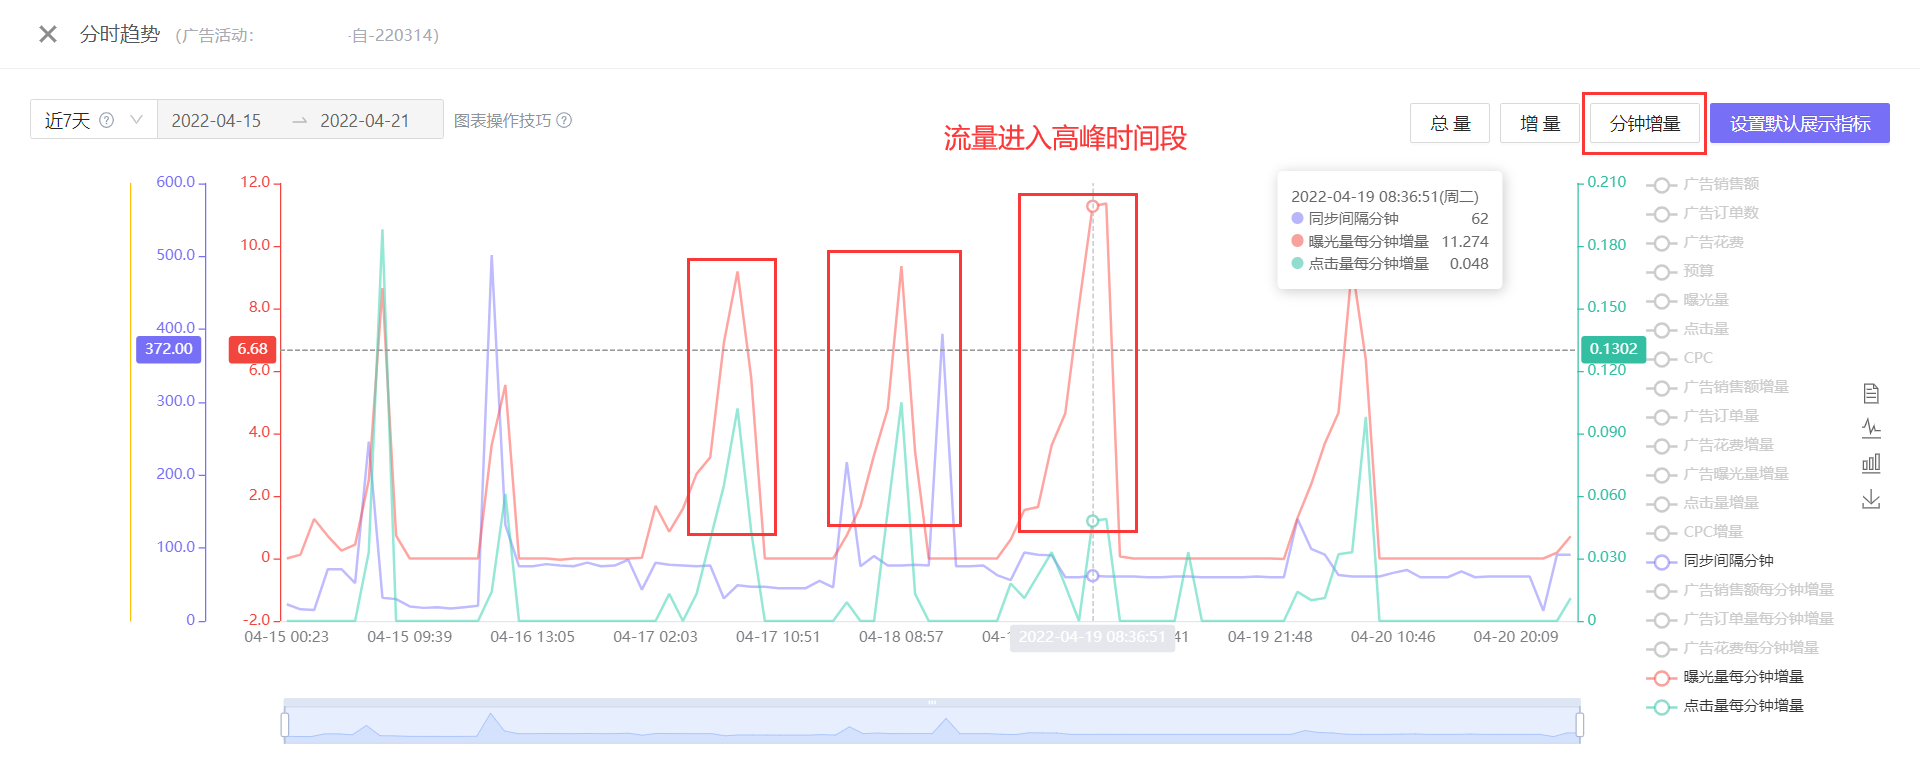
1. Peak Traffic Time for Ads
Through the Hourly Trends chart, you can clearly identify the peak traffic time for the ad and analyze the factors contributing to this peak. For example, was it due to lowering the product price? Or running a promotion? Or is it a natural ad traffic peak?
If it's due to human factors, that's manageable. If it's a natural traffic peak, we need to seize this time period and increase investment to get more orders.
Open SellerSpace's [Ad Campaigns] feature, go to [Hourly Trends], select [Last 7 Days], and choose metrics: Sync Interval (Minutes), Impressions per Minute Increment, and Clicks per Minute Increment (you can also select other objects, time frames, and metrics). You'll then see the ad campaign's traffic trends for the last 7 days.
Generally, to maximize return on ad spend (ROAS), ideal ad performance is: Impression Peak = Click Peak = Order Peak.
 +
+
Clearly Identify Ad Traffic Peaks:
 +
+
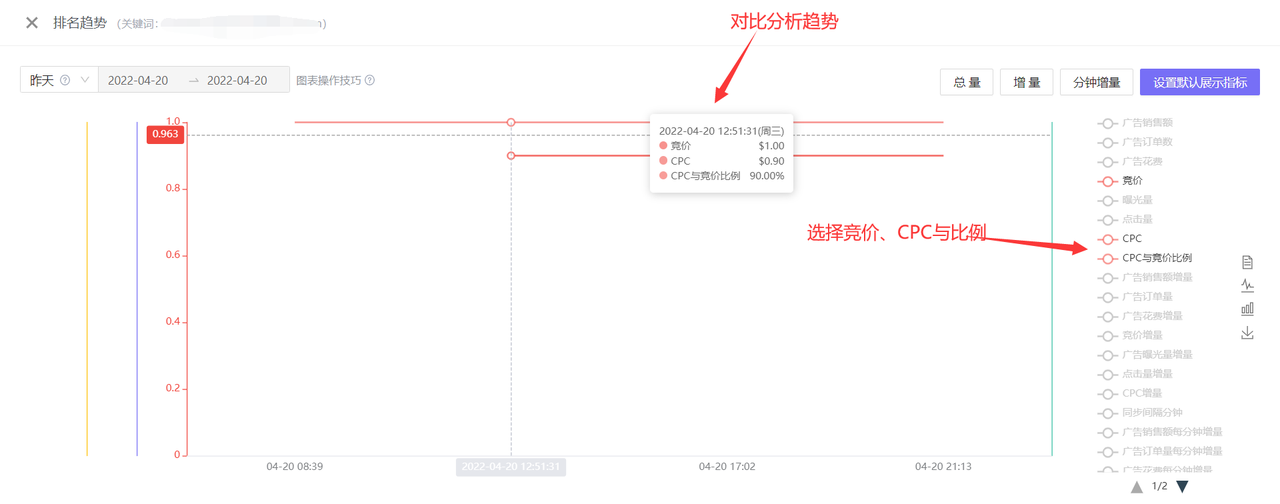
2. Bid vs. CPC
When you optimize ad bids, such as choosing different ad bidding strategies or adjusting bids, you can use the Hourly Trends chart to compare CPC and Bid to confirm whether the ad strategy is appropriate and whether the current bid needs further optimization.
Generally, CPC will fluctuate within approximately 30% of the current bid range. The fluctuation range may be larger, but there are also situations where the CPC is much higher than the current bid. This may be caused by these three reasons:
1. Short selected time range, analyzing immediately after reducing the bid.
2. Bidding strategy selected is [Dynamic bids - Up and down].
3. Bid+ feature for ad placements is enabled.
If, apart from these three reasons, the CPC is still higher than the current bid, then we need to pay attention! This may be because the current ad quality is low, and it cannot compete with other competitors, so a higher price is actually needed to compete.
At this time, we can take measures such as adjusting the targeting direction, optimizing Listing images and descriptions, and even using Vine reviews to improve conversion rates and enhance ad quality scores.
 +
+
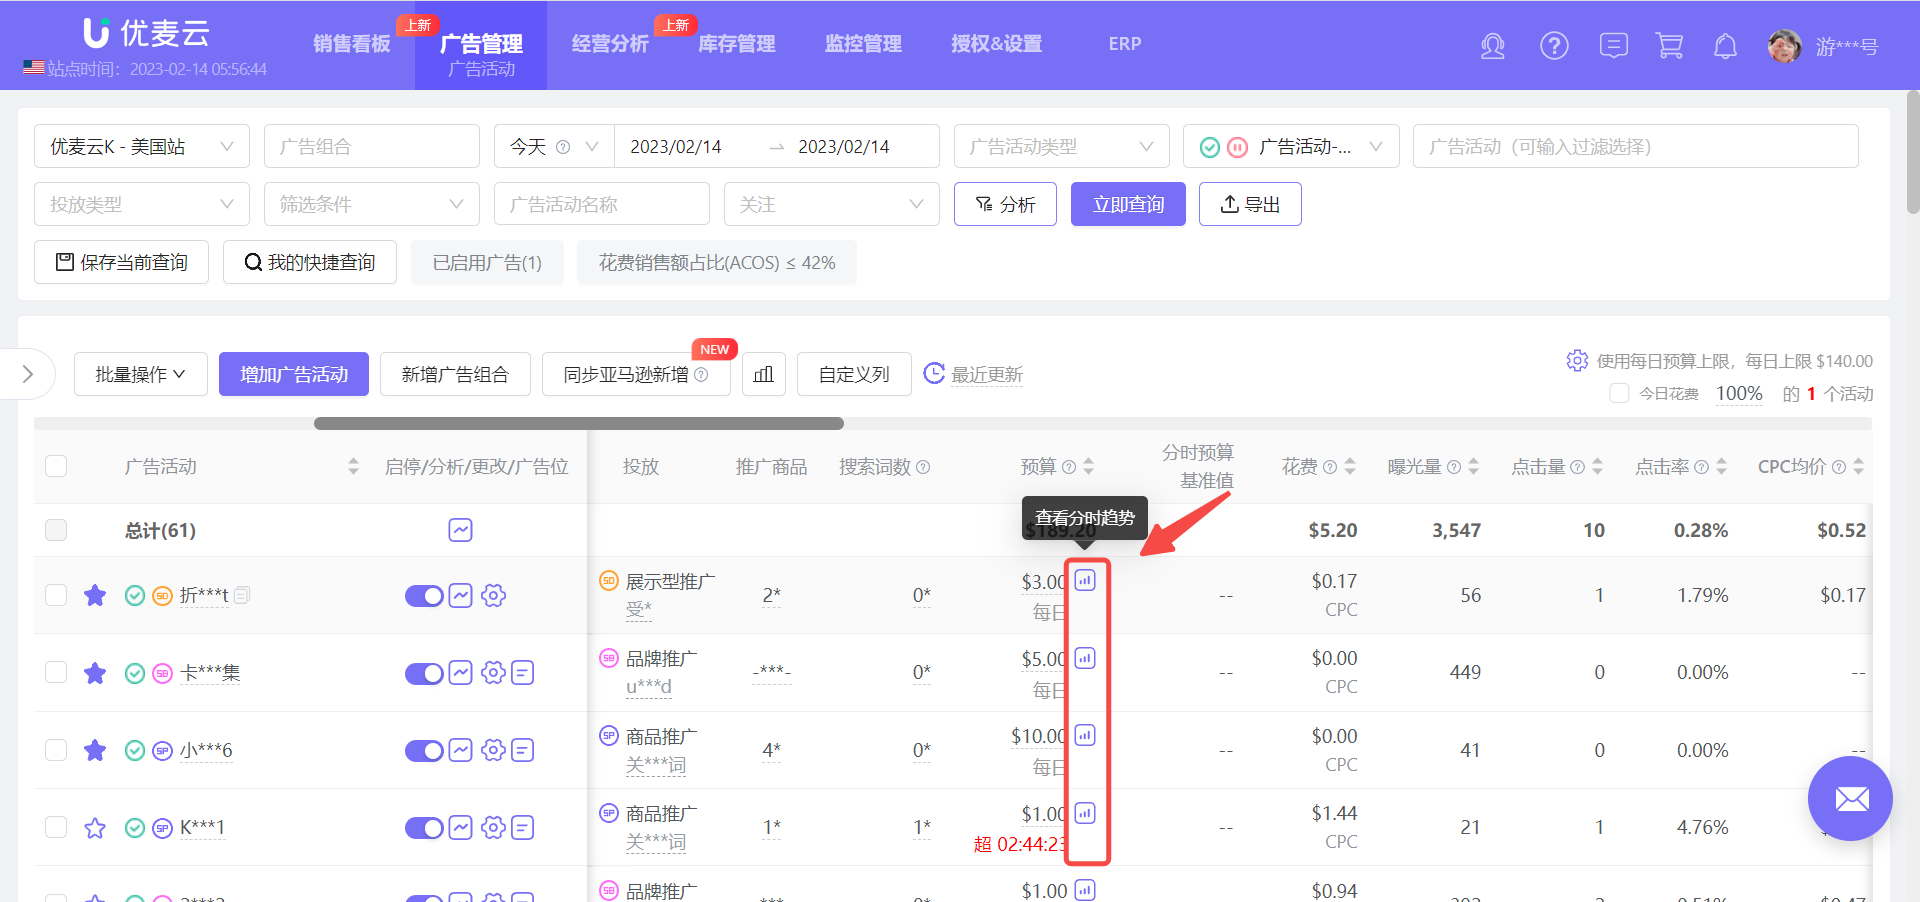
(Image source: Ad Management -> Targeting - Keywords)
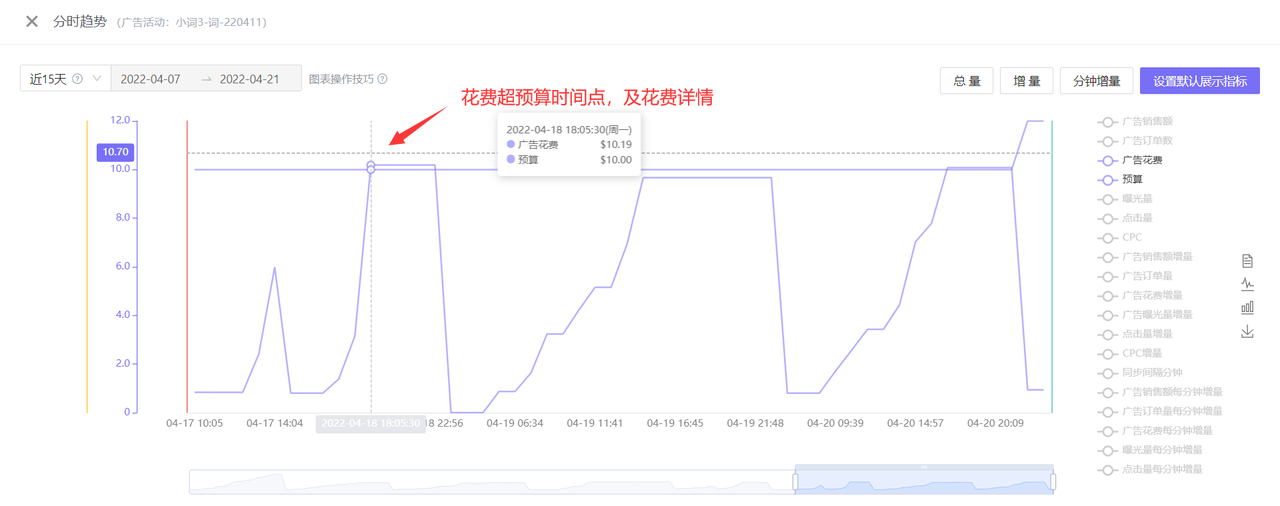
3. Multiple Instances of Exceeding Budget Time Points
When an ad campaign exceeds its budget, the ad naturally pauses. At this time, we can increase the budget to keep the ad online. However, because the initial budget may not be sufficient, and you might increase the budget little by little, it is easy to have multiple instances of exceeding the budget.
If each budget overspend time point is close to each other, it indicates that the click volume is high during the current period. If the conversion rate is also high, we can increase investment to get more orders.
If it is a sudden increase in clicks with a low conversion rate, there may be invalid clicks. At this time, we need to investigate whether there are junk keywords or malicious clicks, and promptly add negations or consider other countermeasures.
By entering [Hourly Trends], we can directly view the time points for each budget overspend, budget spend trends, and conversion situation.
 +
+
(Image source: Ad Management -> Ad Campaigns)
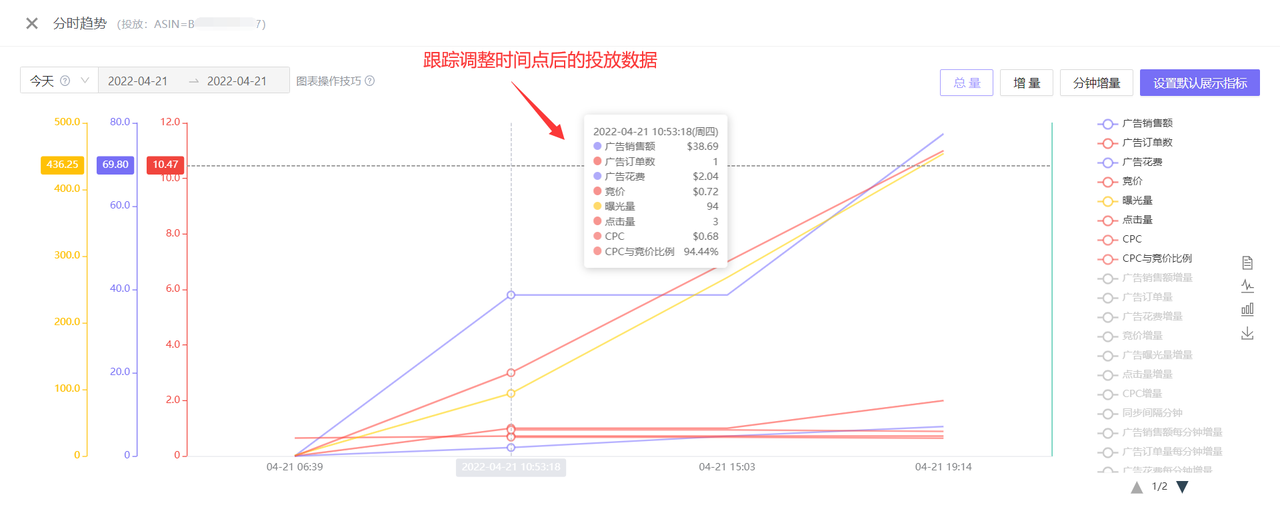
4. Confirming Listing Optimization is Reasonable
Amazon ads are closely related to products. We can also analyze whether our Listing optimization is correct and whether it needs to be adjusted again through the ad campaign data, such as: modifying product images, titles, prices, Search Term keywords, etc.
When adjustments are made to the product, we can track the ad for this product and analyze the ad performance after the adjustment time point. If the performance deteriorates significantly, it means our optimization is unreasonable, and we can first switch back to the original images, prices, etc., and then re-adjust.
Click-Through Rate (CTR) - Influencing Factors: Title, Images, Price, Category, etc.
Conversion Rate - Influencing Factors: Images, Price, Product Description, Reviews, Q&A, etc.
 +
+
(Image source: Ad Management -> Targeting - Non-Keywords)
In addition to the above analysis approaches, you can also flexibly analyze the hourly trends of ad placements according to your actual situation to find optimization strategies that are more suitable for you, improve ad performance, and bring more traffic and orders.
SellerSpace is a concise tool to manage multiple Amazon accounts, focuses on solving various problems encountered by sellers during operating Amazon business.
Mail:support@sellerspace.com
©2018-2025 SellerSpace.COM All Rights Reserved
Online
Service