
Must-Know! How to Analyze Your 24-Hour Peak Sales Period
Since the crackdown on刷单 (brushing orders) and postcard policy violations which led to store closures, many Amazon sellers have begun to shift to premium operations and white-hat strategies. For premium operations, data analysis and ad management are indispensable.
So, how can we use data analysis to help sellers make informed strategic decisions?
Next, YouMail (优优) will teach you a secret weapon: 24-Hour Peak Sales Period.
I. Why Analyze Your Peak Sales Period?
Amazon sellers understand that peak sales times vary across different marketplaces, categories, and products.
· Analyzing quarterly sales data helps determine if a product has seasonal factors;
· Analyzing monthly sales helps with timely inventory replenishment to reduce stockout risks;
· Analyzing daily sales helps adjust operational plans and improve sales;
In addition to this, many sellers, striving for excellence, have started to analyze hourly sales data to find peak conversion periods and adjust advertising and strategies with hourly precision to maximize ROI.
II. Methods to View and Analyze Peak Sales Periods
Since the 24-hour peak sales period can help sellers operate more precisely, how can we view and analyze this hourly data simply and efficiently?
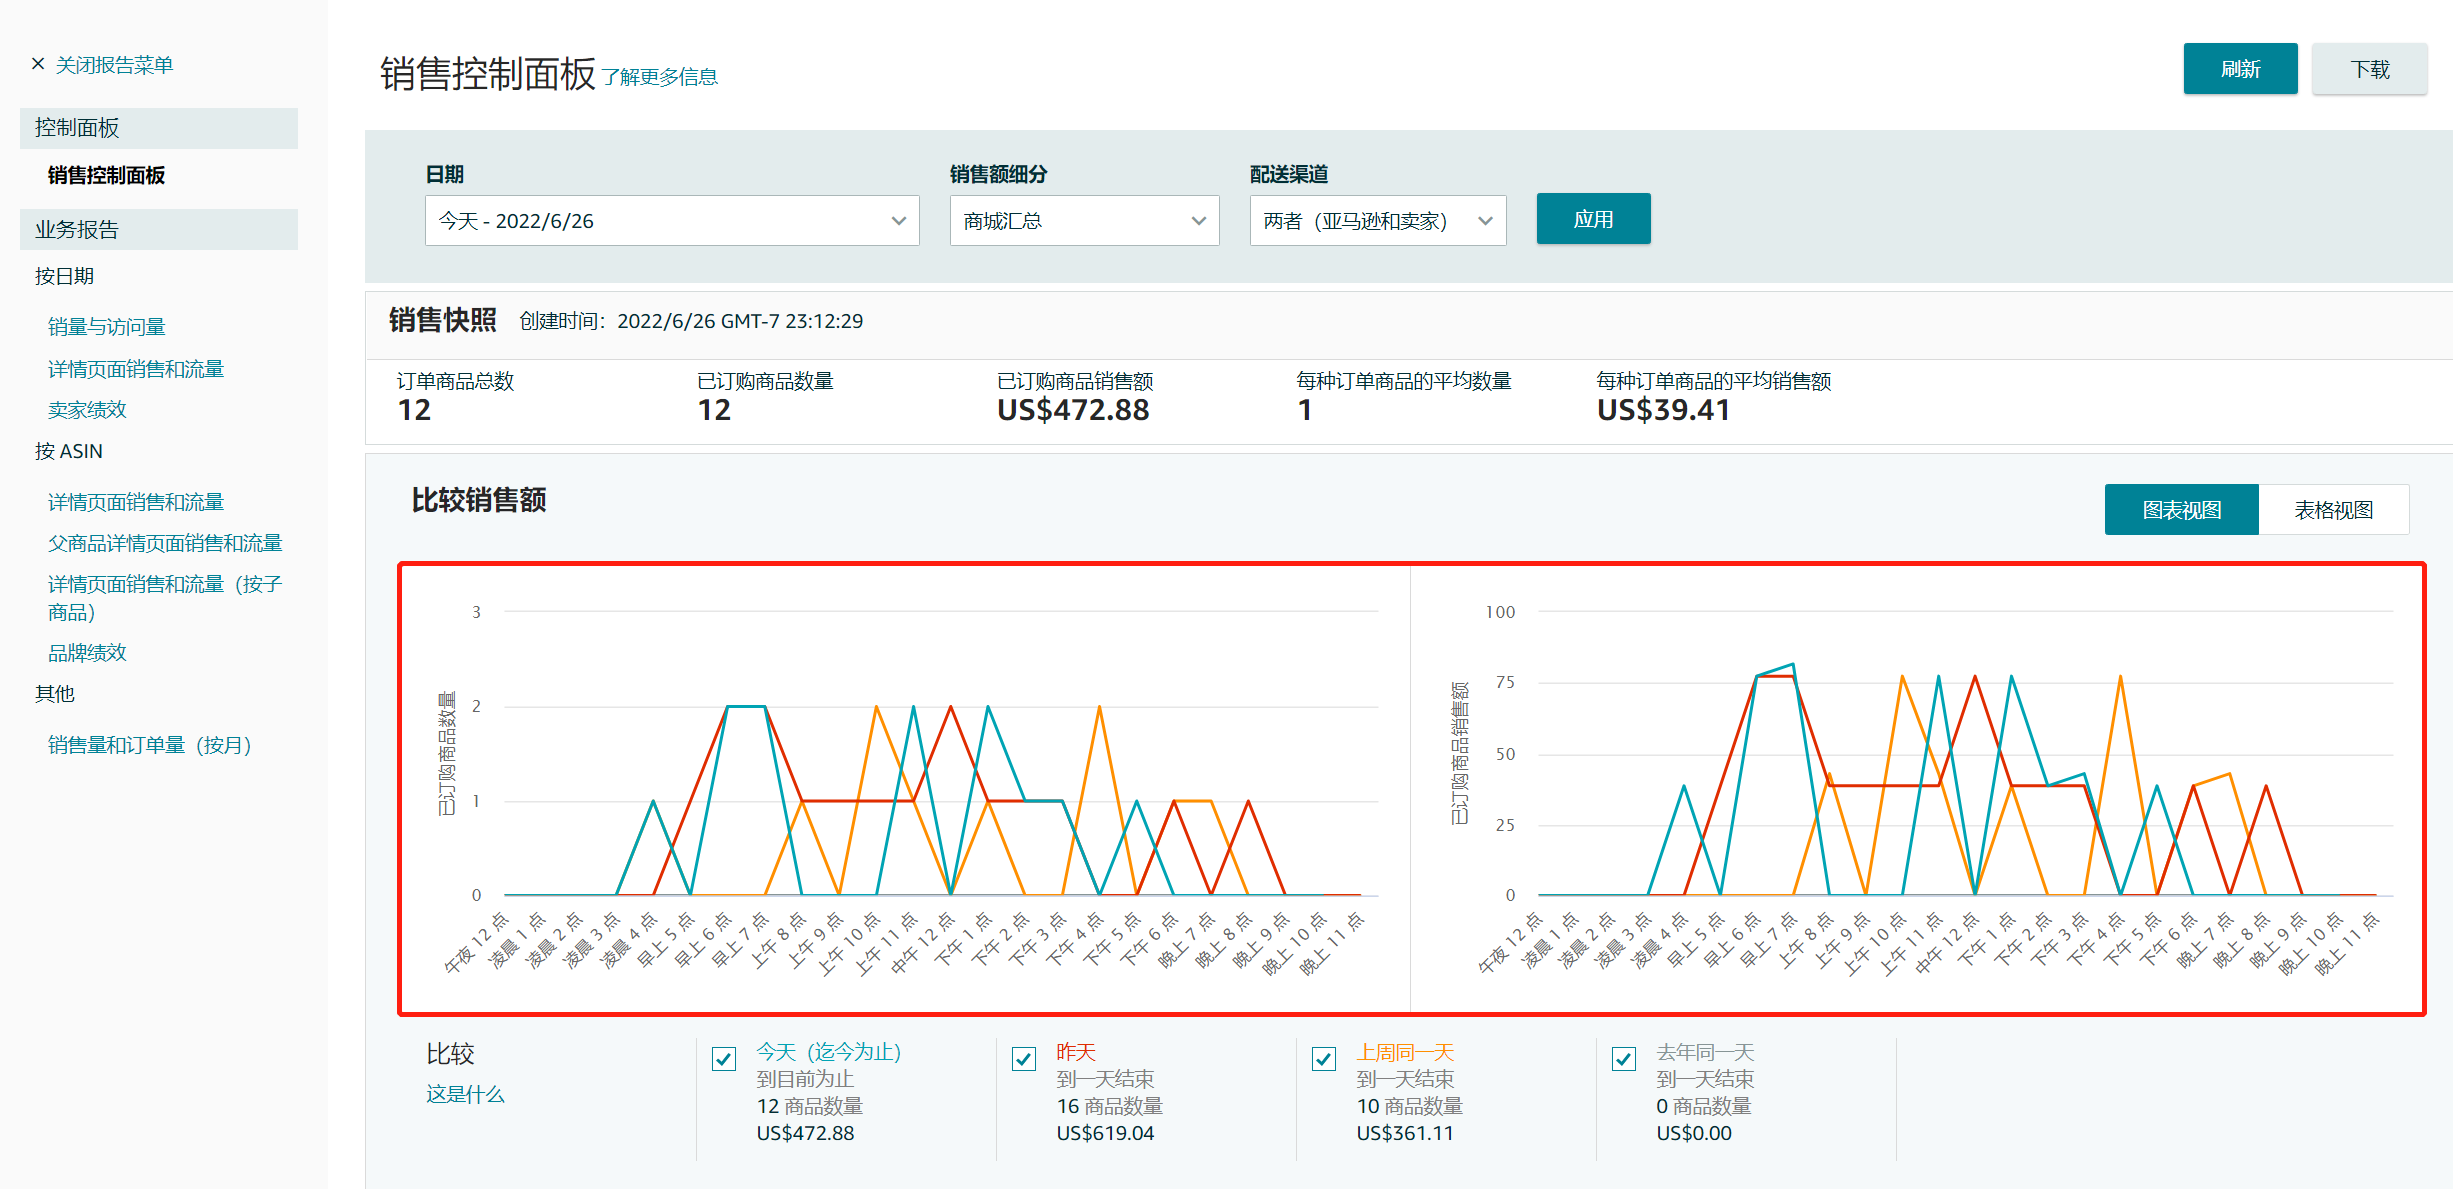
Method 1: Amazon Business Reports
In the Business Reports section of Amazon Seller Central, view 24-hour sales data for today, yesterday, the same day last week, and the same day last year.
However, this method has limitations. For example, it can only view hourly sales data for specific time periods and all products in the store, and cannot view 24-hour sales data for a specific day or a specific product.
Navigation path: Amazon Seller Central -> Reports -> Business Reports
 +
+
(Source: Amazon Seller Central -> Business Reports)
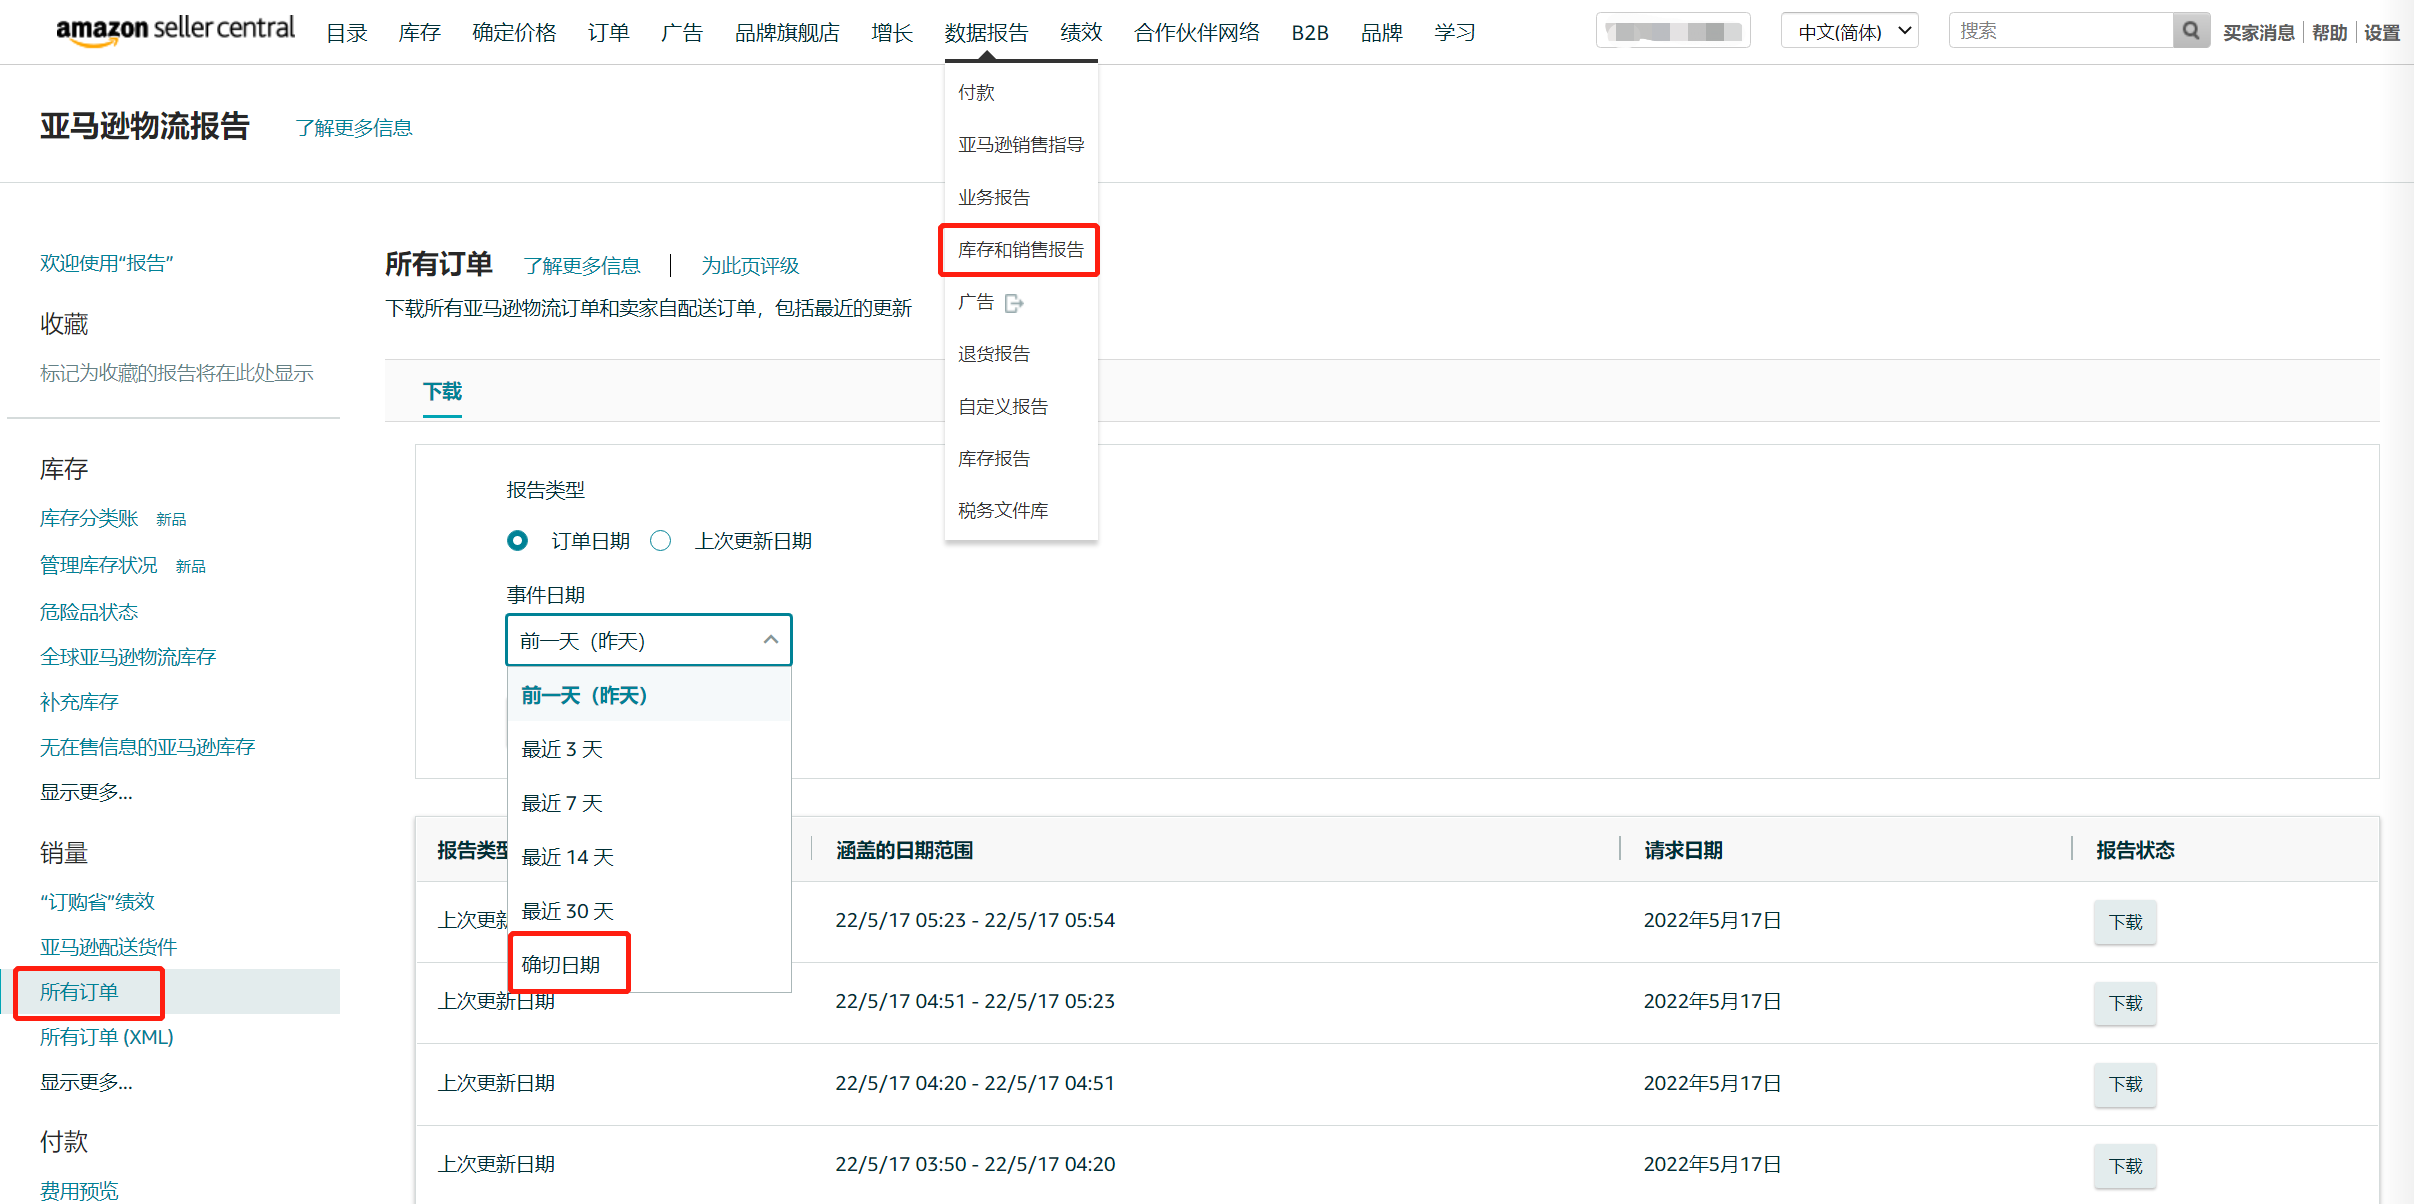
Method 2: Amazon Inventory and Sales Reports
In the All Orders section of Amazon Seller Central, select the corresponding time period and download order data. Decompose the order date into year, month, day, and hour, and then use pivot tables to organize and analyze order data for different time periods.
However, this method also has a drawback. It requires regularly downloading order data and strong data analysis and organization skills. Furthermore, when the order data volume is large or there are many stores, it will consume a lot of manual time and reduce work efficiency.
Navigation path: Reports > Inventory and Sales Reports > All Orders
 +
+
(Source: Amazon Seller Central -> Inventory and Sales Reports)
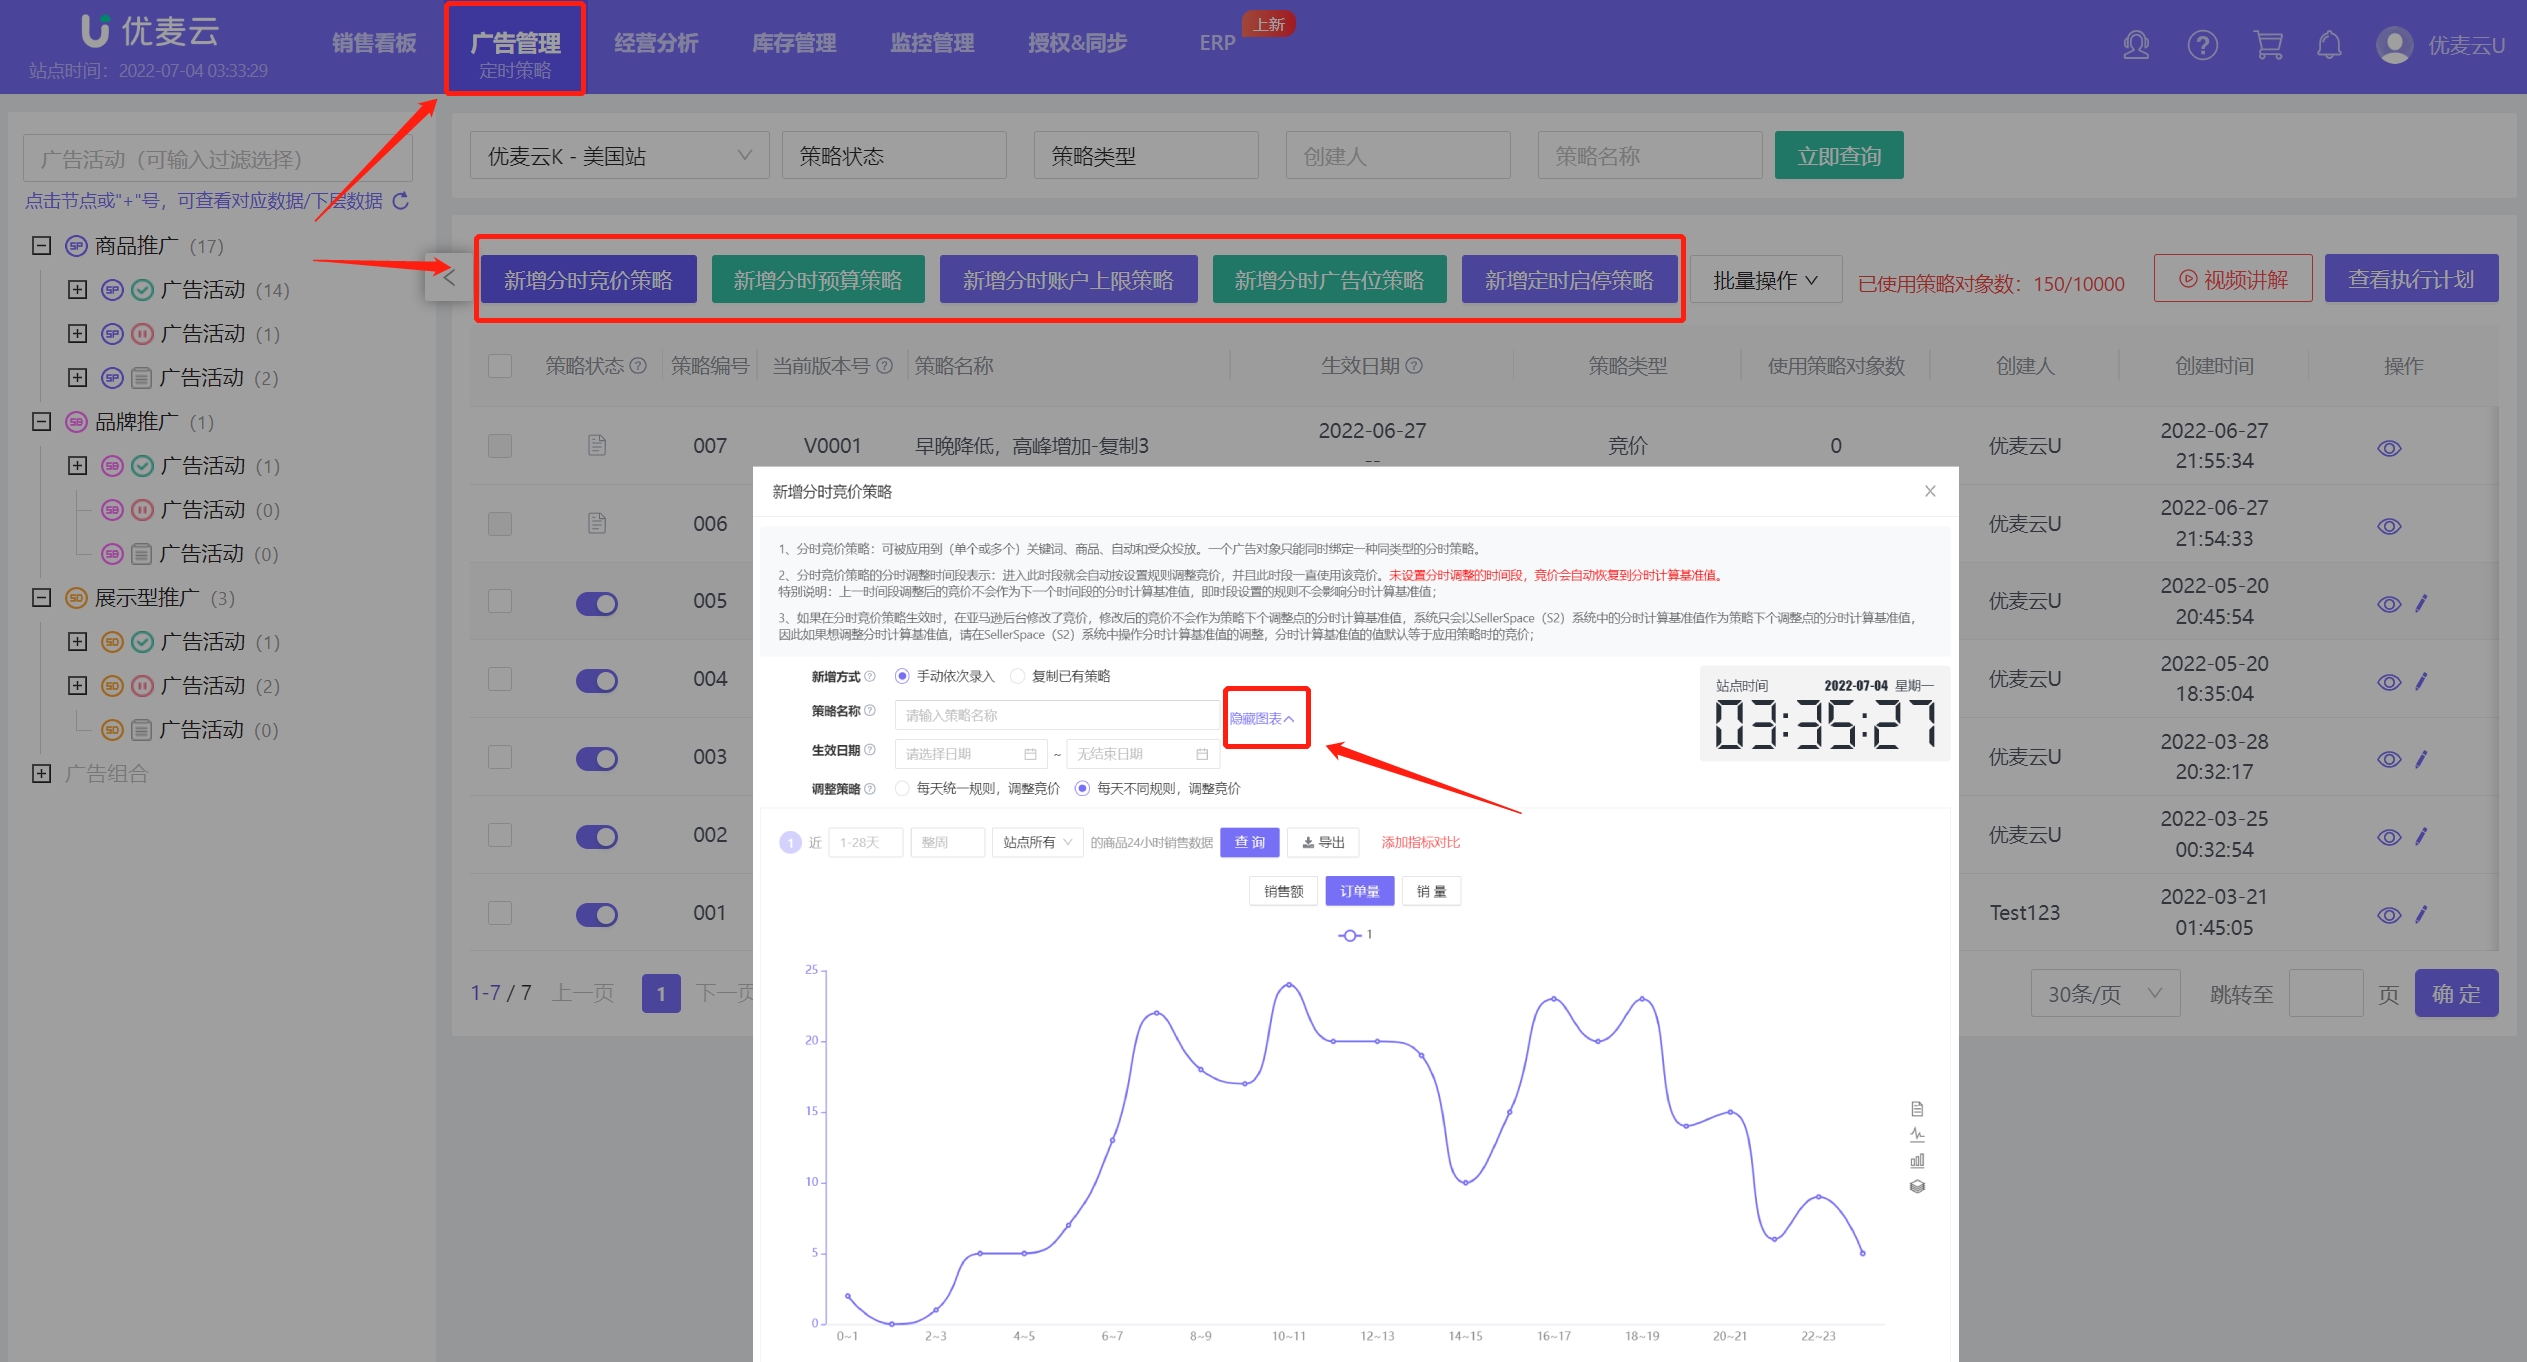
Method 3: YouMailCloud - Hourly Sales in Recent 4 Weeks
Use operational tools to view product hourly sales.
YouMailCloud's Dayparting Strategy feature includes a 【Hourly Sales in Recent 4 Weeks】function, which allows you to view and analyze hourly sales data for any product (ASIN/SKU) in your store for the last 28 days at any time according to your needs, helping sellers efficiently analyze peak sales hours and make more informed operational decisions.
Navigation path: YouMailCloud -> Ad Management -> Dayparting Strategy -> Add Strategy -> Hourly Sales Trend in Recent 4 Weeks
 +
+
(Source: YouMailCloud -> Dayparting Strategy)
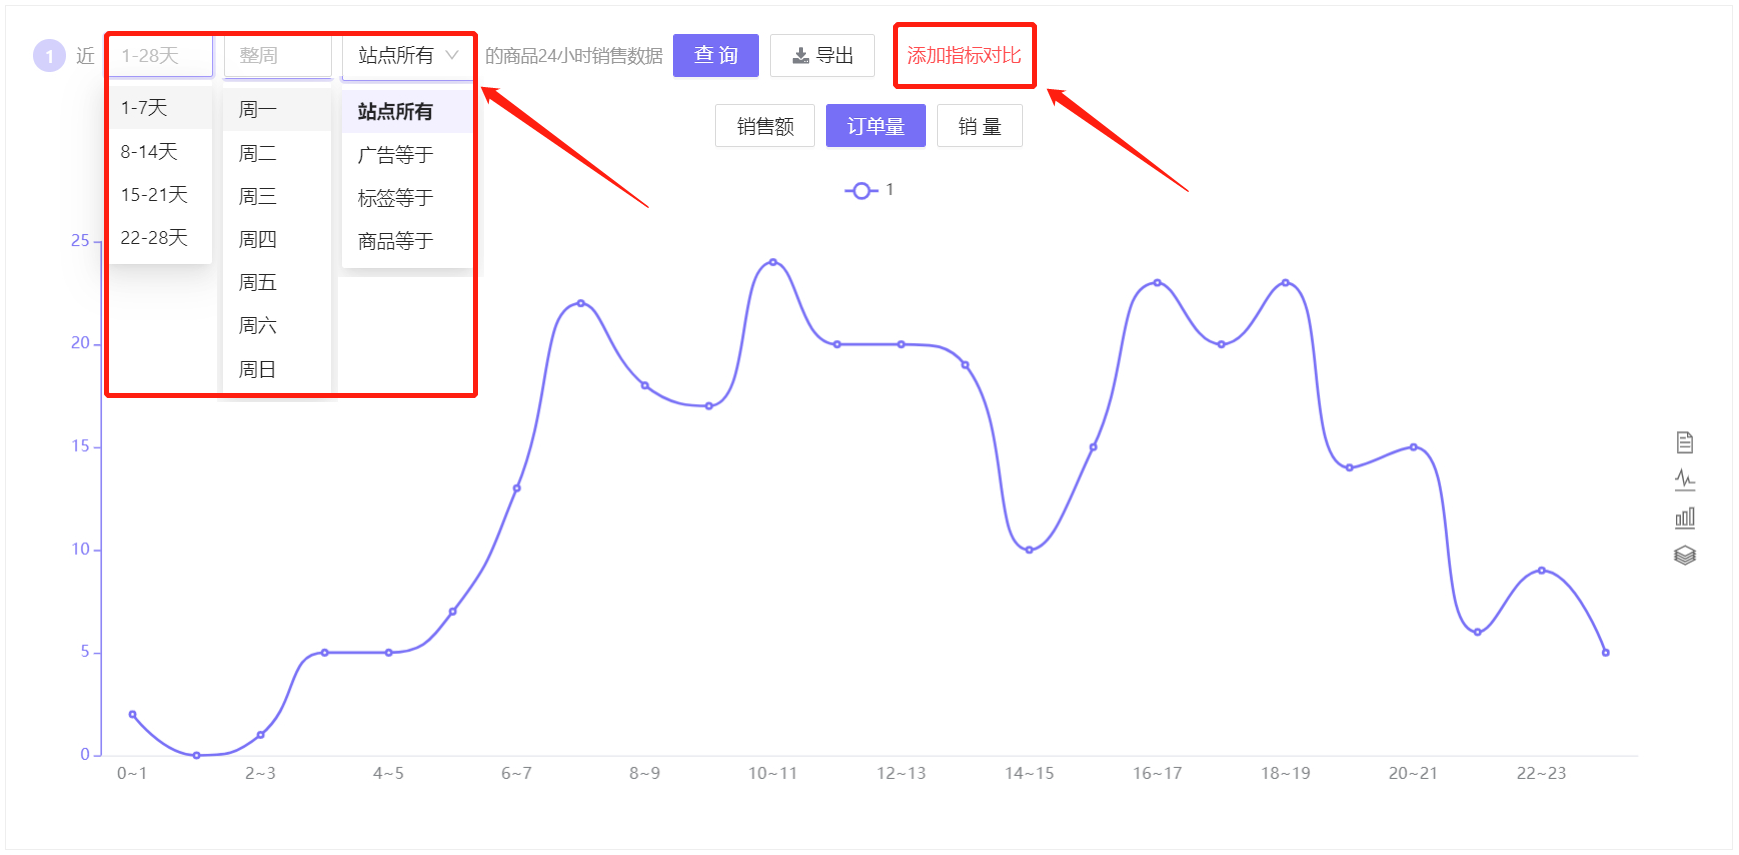
Instructions for using the Hourly Sales in Recent 4 Weeks function:
· Up to 28 days of time dimension can be selected in the recent time frame. 1 day indicates yesterday (marketplace time), and so on;
· Select by Monday to Sunday to view and analyze the peak sales hours for different days of the week within a week;
· View dimensions: Marketplace, Ad Campaign, Tag, Product, where Ad Campaign can be specific to ad groups;
· Add metric comparison to compare hourly sales data for different products or the same product at different times.
 +
+
(Source: YouMailCloud -> Dayparting Strategy Tool)
And there are different data presentation formats to adapt to different analysis habits for higher analysis efficiency!
Analyzing the 24-hour hourly peak sales period of products not only helps us clearly understand the hourly conversion situation of products, but also helps us set more reasonable advertising strategies to cooperate with various operational methods to improve product conversion rates. For example: solving the allocation of advertising budget, bids, and ad placements; selecting better off-Amazon advertising time, etc.
During high-conversion time periods, set higher advertising budgets, bids, and ad placements, and conduct higher-quality off-Amazon promotions to display products in front of more users and promote more order transactions.
In summary, if you are a seller who is interested in data analysis, you can use the above methods to find the focus of operations by analyzing product hourly sales data to achieve the purpose of improving conversions.
SellerSpace is a concise tool to manage multiple Amazon accounts, focuses on solving various problems encountered by sellers during operating Amazon business.
Mail:support@sellerspace.com
©2018-2025 SellerSpace.COM All Rights Reserved
Online
Service